1
Derivatives Rollover Report |April 30, 2021
For Private Circulation Only
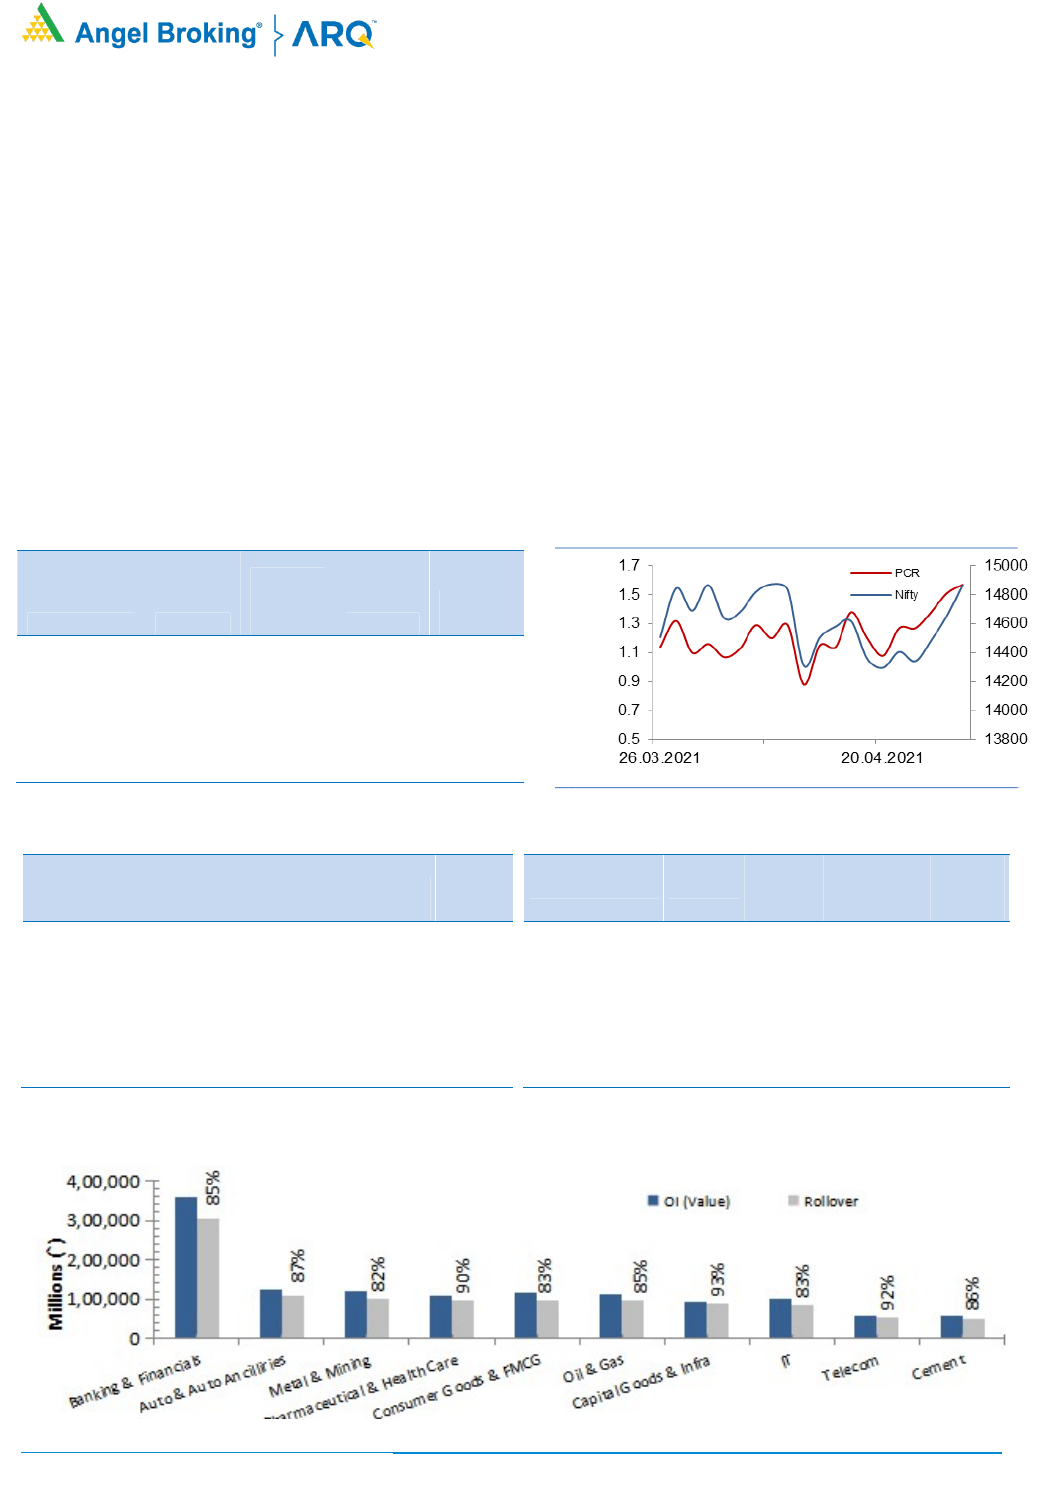
NIFTY & PCR Graph
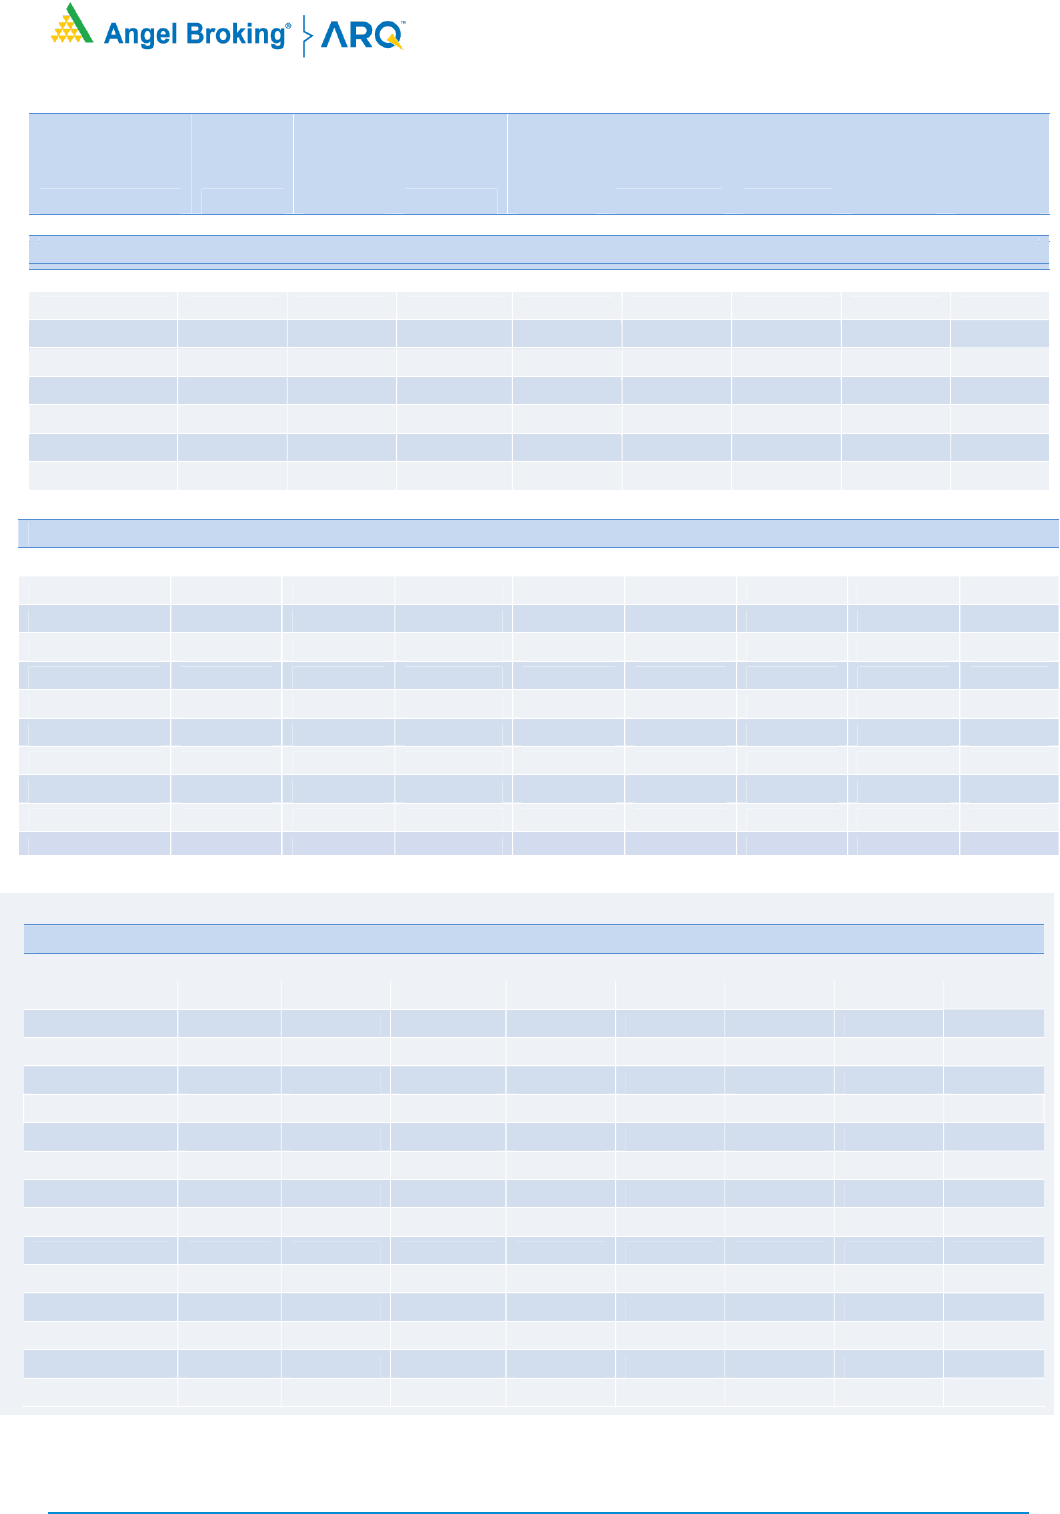
Monthly Gainers
Scrip Price
Price
Change
(%)
Open
Interest
Ol
Change
(%)
JSWSTEEL 729.30
65.00
33585300
1.76
SAIL 113.25
55.14
102828000
(18.15)
JINDALSTEL 456.90
46.51
28315000
(1.13)
TATASTEEL 1037.35
42.32
48433000
20.76
CADILAHC 564.90
33.33
15562800
60.41
Note: Stocks which have more than 1000 contract in Futures OI.
Monthly Losers
Scrip Price
Price
Change
(%)
Open
Interest
Ol
Change
(%)
M&MFIN 165.60
(14.79)
16968000
26.36
ESCORTS 1132.80
(11.30)
2750550
58.41
DLF 250.05
(10.52)
29508600
27.16
RBLBANK 190.40
(9.93)
21990700
13.37
IDEA 8.45
(7.65)
622020000
88.54
Note: Stocks which have more than 1000 contract in Futures OI.
Post the corrective phase in the March series, Nifty started April series with a low open interest base. We witnessed some pu
llback initially
towards the 15000 mark, but marke
ts did not sustain At higher levels. The worries of rising Covid cases in the country led to some nervousness
and hence during mid of the series, Nifty corrected up to 14150. However, the drama was not over yet as we witnessed a v-
shaped recovery
towards the fag end to reclaim the 15000 mark
In the series gone by, we saw decent volatility within a broad 1000 point range in the Nifty where mixed positions were forme
d. However, for
most part of the series the Bank Nifty witnessed addition of short positions. The rollover in Nifty stood at 66.28 percent versus its 3-
month
average of 75.40 percent while in Bank Nifty it is at 64.60 percent versus its average of 76.84 percent. The lower rollover i
n both the indices
indicates that market participant have lightene
d up their positions during the expiry. However, if we look at FII's data, then it is seen that they
have squared off much of their short positions and have rolled longs in index futures. Their 'Long Short Ratio' stands at 78
percent at the start
of May series.
The above data indicates that FII's are bullish on our market from a near term perspective. However, looking at the low rollo
ver figures, we
advise traders to keep a track of new additions at the start of the new series and then take trading bets.
As of now, the immediate supports for
the index are placed around 14500 and 14200 while 15000 and 15200 are to be seen as resistances.
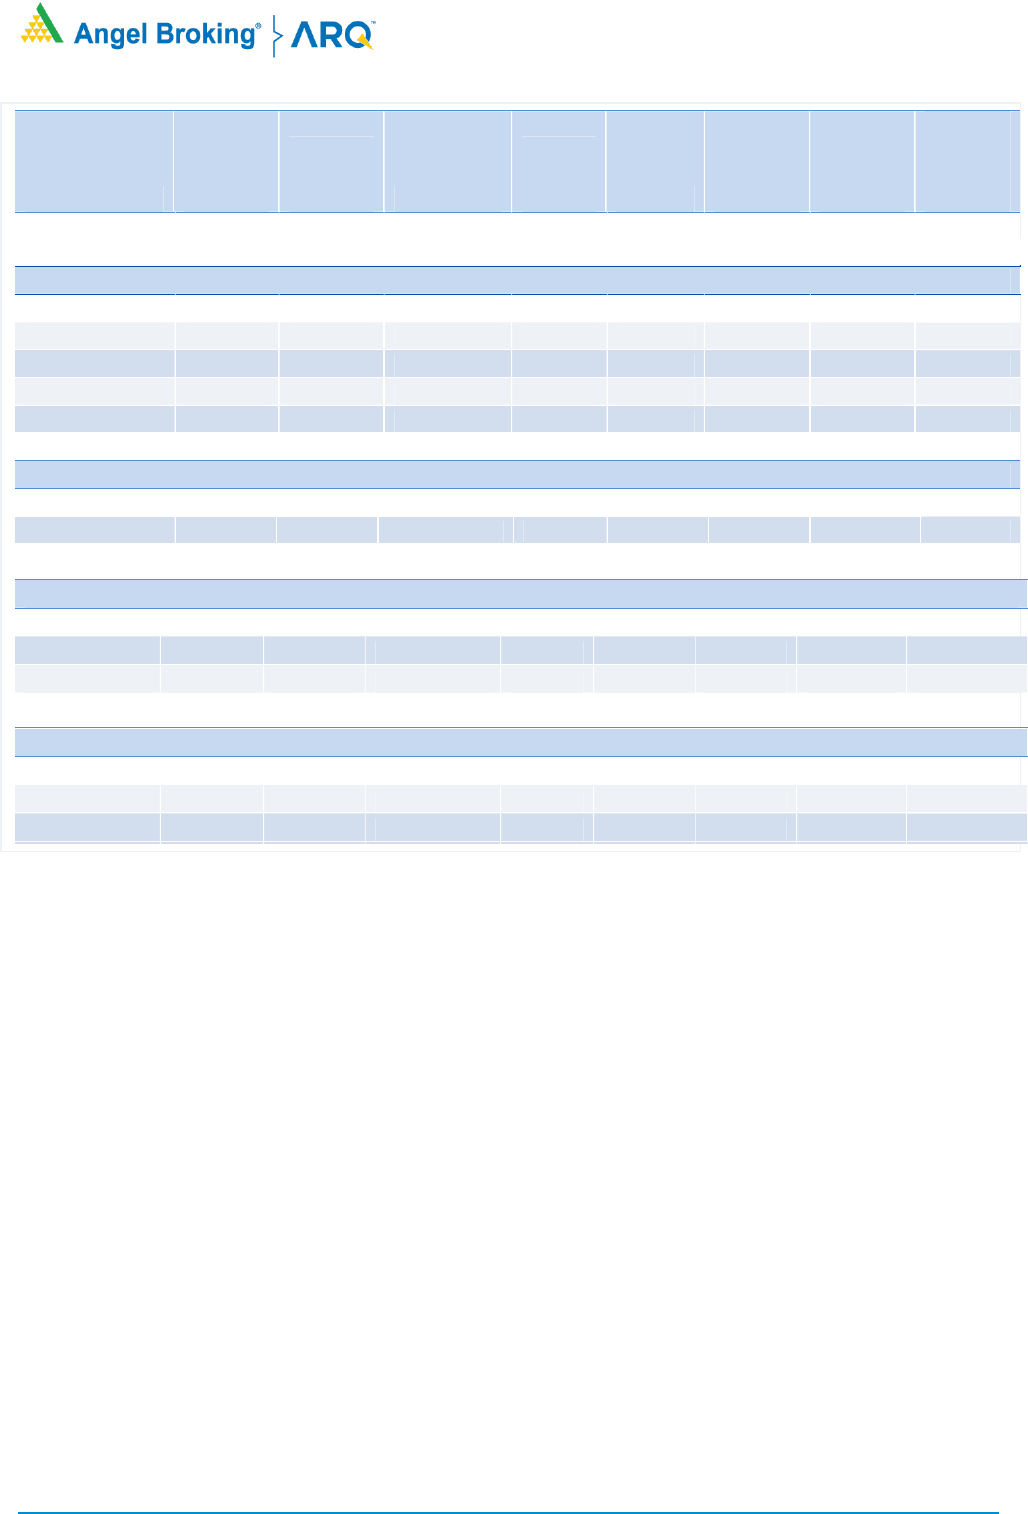
Indices Change
INDEX Price
Price
Change
(%) Rollover
3 month
avg.
NIFTY 14894.90 3.98
66.28 75.40
BANKNIFTY 33714.50 2.15
64.60 76.84
FINNIFTY 16047.05 3.70
48.07 44.85
- - - - -
- - - - -
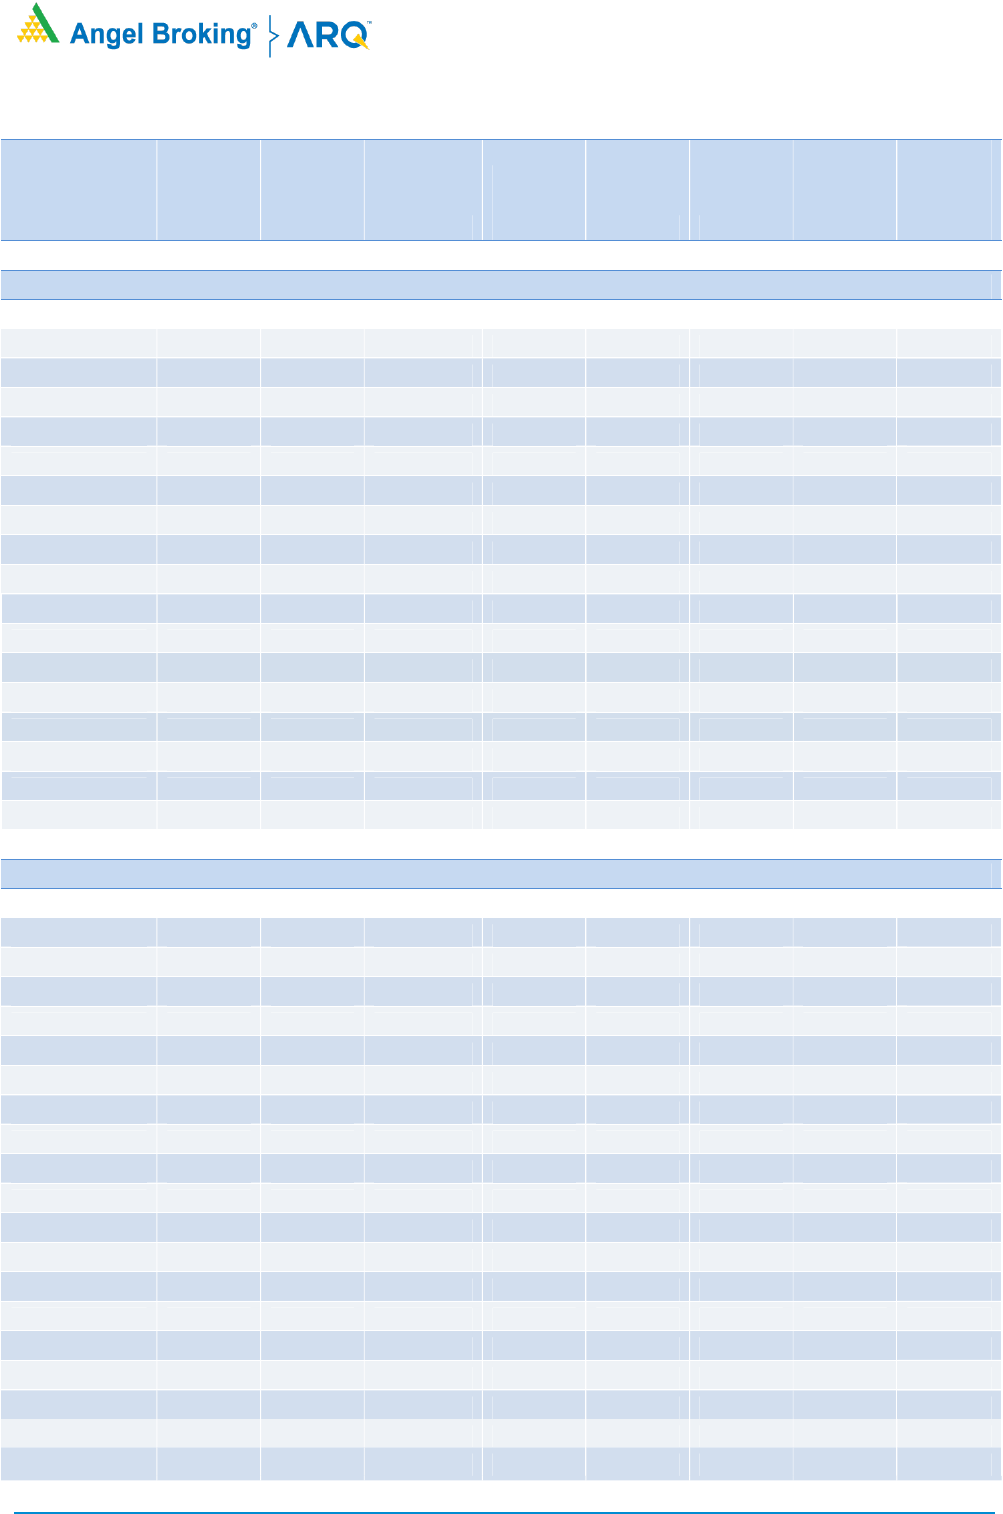
Derivatives Rollover Report
For Private Circulation Only
2
Scrip Price
Price
Change
(%) OI Futures
OI
Change
(%) COC (%) PCR-OI
Rollover
(%)
Average
Rollover
(3month)
(%)
AUTO & AUTO ANCILLARIES
AMARAJABAT 805.95 (5.28) 3938000 78.11 6.09 0.97 94.64 96.01
APOLLOTYRE 208.90 (5.15) 14560000 54.98 5.33 0.66 91.63 92.16
ASHOKLEY 115.80 4.65
30357000 (26.56) 7.93 0.81 77.42 86.29
BAJAJ-AUTO 3847.35 8.87
1938750 (9.10) 3.74 0.28 87.68 90.18
BALKRISIND 1772.80 9.96
1555200 (9.14) 4.32 0.33 89.75 94.09
BHARATFORG 607.75 5.87
6262500 22.25 6.57 0.37 92.51 94.76
BOSCHLTD 13630.10 (1.16) 89050 3.85 5.95 0.89 73.29 89.63
EICHERMOT 2476.55 (4.89) 2660000 15.17 7.22 0.46 90.22 93.62
ESCORTS 1132.80 (11.30) 2750550 58.41 2.77 0.85 89.72 93.30
EXIDEIND 178.60 (1.76) 13716000 6.48 2.93 0.50 86.00 92.19
HEROMOTOCO 2871.75 (2.78) 3009600 (12.77) 5.29 0.83 82.79 91.19
M&M 778.70 (2.54) 10019800 30.77 6.90 0.64 80.52 85.66
MARUTI 6602.15 (3.47) 2544900 12.04 7.24 0.75 86.15 92.07
MOTHERSUMI 220.85 12.08
28238000 (0.52) 8.62 0.43 87.43 91.85
MRF 77966.40 (5.39) 38090 (8.68) 5.13 0.19 81.09 90.65
TATAMOTORS 303.55 5.38
93309000 2.24 7.12 0.71 91.81 93.80
TVSMOTOR 637.55 14.50
4894400 71.96 7.82 0.49 73.90 85.92
BANKING & FINANCIALS
AUBANK 1121.10 (3.42) 2883000 317.83 -3.94 0.39 57.93 #N/A
AXISBANK 721.70 3.02
39262800 15.99 4.17 0.72 78.17 86.54
BAJAJFINSV 11224.80 22.95
866625 54.07 5.58 0.89 88.37 92.46
BAJFINANCE 5493.90 6.41
3785750 7.25 2.15 1.22 86.79 92.23
BANKBARODA 67.20 (4.88) 112577400 1.84 6.82 0.73 84.00 83.77
CANBK 140.30 (3.07) 60480000 10.17 7.48 0.69 94.94 96.25
CHOLAFIN 591.20 9.13
4045000 (9.15) -2.86 0.58 83.57 89.11
CUB 169.10 4.35
4879400 (31.03) 3.48 0.46 74.32 #N/A
FEDERALBNK 77.85 1.30
58570000 (14.93) 5.04 0.53 92.56 94.27
HDFC 2554.05 2.61
14299500 2.63 7.86 0.53 87.42 89.87
HDFCBANK 1471.75 (0.30) 20464950 (11.22) -0.66 0.88 77.45 89.65
IBULHSGFIN 183.00 (7.25) 23312000 (20.20) 6.80 0.68 87.12 92.17
ICICIBANK 622.60 8.03
75325250 (17.11) 2.41 0.79 85.95 93.34
ICICIPRULI 527.20 22.12
7092000 1.00 6.71 0.38 81.46 90.70
INDUSINDBK 942.65 (2.41) 18918000 (13.44) 4.44 0.82 91.54 93.35
KOTAKBANK 1810.90 1.90
10627200 (6.02) 4.22 0.77 84.79 90.33
L&TFH 90.10 (4.81) 33866580 24.59 2.90 0.59 90.83 84.98
LICHSGFIN 412.95 (0.55) 4908000 (17.07) 4.59 0.58 81.80 90.78
M&MFIN 165.60 (14.79) 16968000 26.36 2.37 0.57 77.41 87.70
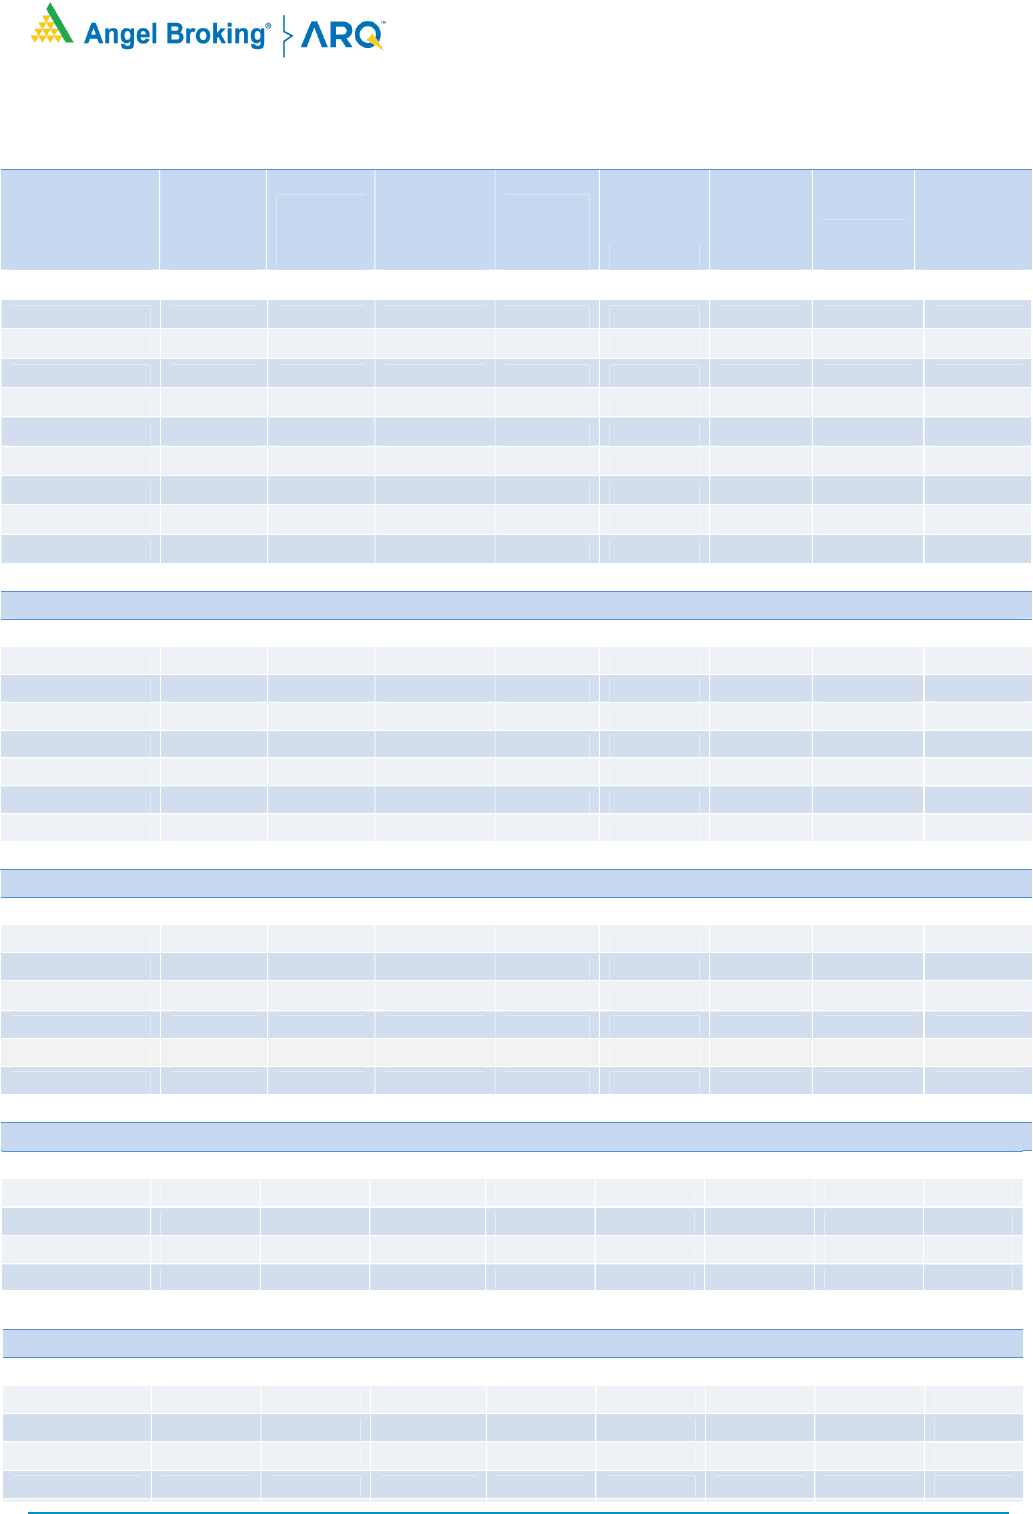
Derivatives Rollover Report
For Private Circulation Only
3
Scrip Price
Price
Change
(%) OI Futures
OI
Change
(%) COC (%) PCR-OI
Rollover
(%)
Average
Rollover
(3month)
(%)
MANAPPURAM 147.90 (1.17) 23034000 15.18 6.20 0.80 86.11 91.81
MFSL 921.15 8.00
1985100 (4.20) 9.41 0.47 86.27 90.29
MUTHOOTFIN 1171.90 (1.54) 2765250 6.68 6.32 0.92 90.26 85.89
PFC 107.80 (5.77) 30931800 (3.71) 7.91 0.79 77.58 85.32
PNB 35.25 (1.26) 176816000 (11.01) 7.44 0.77 73.69 82.10
RBLBANK 190.40 (9.93) 21990700 13.37 0.69 0.82 89.01 80.26
RECLTD 128.55 (2.43) 15786000 4.53 7.14 0.64 69.33 80.05
SBIN 360.70 0.66
93138000 6.60 4.72 0.81 90.44 92.61
SRTRANSFIN 1423.70 3.42
4044000 27.39 6.81 0.33 81.81 87.17
CAPITAL GOODS & INFRASTRUCTURE
ADANIPORTS 751.35 8.29
71817500 22.20 8.03 0.54 95.91 94.78
BHEL 47.40 (2.47) 95319000 5.24 5.52 0.71 92.96 92.83
GMRINFRA 22.80 (5.20) 147667500 (0.58) -2.85 0.86 82.43 89.53
HAVELLS 1015.25 (1.67) 4516000 (5.19) 7.30 0.39 90.99 93.84
LT 1366.20 (1.21) 14251375 12.27 7.24 0.81 90.37 93.56
SIEMENS 1889.20 4.24
905850 51.24 8.16 0.14 89.03 92.28
VOLTAS 970.75 0.35
3309000 4.68 4.92 0.43 80.49 89.37
CEMENT
ACC 1883.35 1.58
2442000 (19.37) 4.41 0.57 78.85 89.49
AMBUJACEM 314.30 5.86
18489000 24.96 1.04 0.34 90.02 88.75
GRASIM 1353.95 (2.25) 13661950 (10.75) 3.14 1.23 82.05 87.27
RAMCOCEM 989.05 3.53
1780750 3.76 -0.66 0.01 89.95 92.15
SHREECEM 28606.50 3.14
154150 23.27 7.45 2.40 84.74 89.74
ULTRACEMCO 6419.40 (4.59) 2405000 52.78 7.61 0.61 91.02 94.93
CHEMICAL & FERTILIZERS
CHEMICALS & FERTILIZERS
DEEPAKNTR
1797.85 16.51
1225500 73.58 7.69 0.40 74.77 #N/A
PIDILITIND
1860.10
4.83
1846000
0.35
8.39
0.58
91.18
95.85
TATACHEM 767.55 4.07
8456000 (3.40) 7.34 0.55 86.85 90.04
UPL
617.80
2.71
18344300
0.48
4.23
0.51
80.95
92.02
Consumer Goods & FMCG
ASIANPAINT 2623.30 8.47
3795000 (30.73) 4.91 0.58 82.79 92.57
BERGEPAINT 717.60 (2.85) 2920500 (1.63) 5.29 1.27 87.25 93.95
BRITANNIA 3452.55 (0.23) 1848000 0.47 -6.18 0.52 76.34 87.78
COLPAL 1489.90 (2.20) 3627400 10.68 3.64 0.80 93.15 96.27
CONCOR
556.00
(5.86)
7139784
40.51
7.43
0.32
99.05
94.03
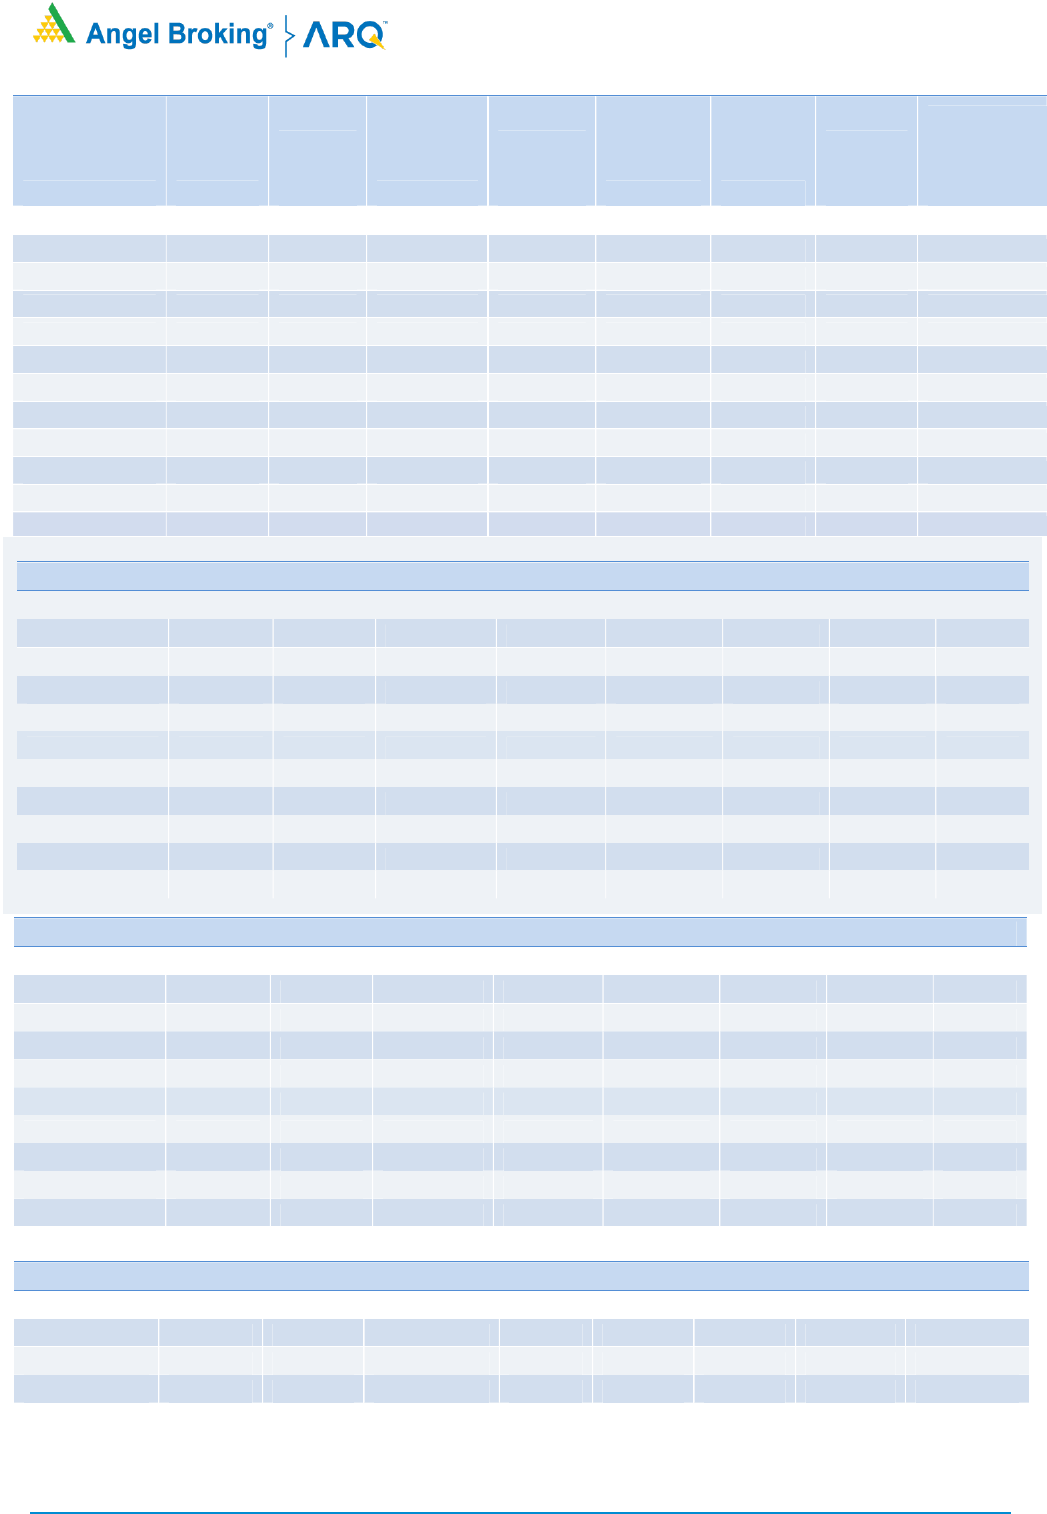
Derivatives Rollover Report
For Private Circulation Only
4
Scrip Price
Price
Change
(%) OI Futures
OI
Change
(%) COC (%) PCR-OI
Rollover
(%)
Average
Rollover
(3month)
(%)
DABUR 543.20 4.21
11400000 38.39 3.13 0.49 92.59 94.43
GODREJCP 703.50 2.87
3993000 (24.03) 2.60 0.75 73.44 89.59
HINDUNILVR 2422.15 7.33
6888600 31.70 7.85 0.45 82.82 90.74
ITC 204.55 (3.83) 98220800 (6.94) 1.60 0.62 75.20 88.40
JUBLFOOD 2951.60 3.53
1288000 5.10 5.97 0.31 83.94 90.64
MARICO 412.30 3.01
7196000 5.67 7.79 0.31 91.30 86.68
MCDOWELL-N 528.25 (3.90) 13235000 (1.22) 7.57 0.67 93.27 95.86
NESTLEIND 16599.25 2.24
300250 3.96 7.62 1.01 86.01 90.30
TATACONSUM 674.15 9.05
6627150 (40.38) 4.46 0.42 35.50 75.65
TITAN 1515.45 3.53
5472750 (4.11) 7.48 1.01 85.70 91.07
UBL
1185.70
(2.64)
975800
3.18
-
11.98
0.92
79.79
81.36
METALS & MINING
COALINDIA 128.65 (0.43) 35418600 (12.80) 6.11 0.59 77.35 81.43
HINDALCO 374.45 18.31
34851500 25.93 8.06 0.48 81.98 84.18
JINDALSTEL 456.90 46.51
28315000 (1.13) 7.60 0.54 84.80 92.48
JSWSTEEL 729.30 65.00
33585300 1.76 5.02 1.05 85.65 92.34
NATIONALUM 65.10 23.88
85391000 38.72 7.05 0.52 93.16 91.07
NMDC 155.00 23.65
44307100 11.82 8.46 0.50 77.08 81.73
SAIL 113.25 55.14
102828000 (18.15) 8.69 0.70 73.22 86.59
TATASTEEL 1037.35 42.32
48433000 20.76 7.58 0.98 85.42 91.08
VEDL 256.60 15.12
67425000 (9.69) 7.92 0.59 69.04 74.72
Media
PVR 1180.40 (4.76) 1678061 19.40 -9.16 1.58 65.38 84.62
SUNTV 522.75 14.69
13618500 15.80 8.28 0.23 95.71 94.79
ZEEL 187.50 (5.26) 63780000 37.40 6.64 0.59 94.94 95.96
INFORMATION TECHNOLOGY
COFORGE 2848.80 2.55
366375 (19.79) 1.86 0.24 67.57 84.16
HCLTECH 914.90 (5.00) 21849100 35.11 7.67 0.78 89.40 94.38
INFY 1360.80 1.12
27963600 0.43 4.28 0.56 84.59 92.45
LTI 3862.45 0.03
389250 66.77 3.88 1.75 84.97 #N/A
LTTS 2637.55 5.19
502600 11.64 4.69 0.95 85.45 #N/A
MPHASIS 1774.80 5.57
261625 (20.06) 3.54 5.89 63.54 #N/A
MINDTREE 2106.85 6.05
1436000 0.00 5.59 0.51 65.25 84.14
TCS 3128.70 1.19
5790300 (15.97) 5.65 0.61 78.02 89.85
TECHM 981.00 0.41
10496400 (2.22) 5.47 0.78 86.75 92.51
WIPRO 491.10 21.77
28380800 (11.04) 3.33 0.82 72.88 87.40
Derivatives Rollover Report
For Private Circulation Only
5
Scrip Price
Price
Change
(%) OI Futures
OI
Change
(%) COC (%) PCR-OI
Rollover
(%)
Average
Rollover
(3month)
(%)
INFORMATION TECHNOLOGY
HCLTECH 564.00
(0.70)
22885800
(1.26)
8.14
0.58
98.56
96.78
INFY 730.55
3.77
24351600
(52.50)
2.86
0.74
55.98
79.52
MINDTREE 782.95
10.93
1041600
(14.29)
-15.63
0.59
93.13
93.37
NIITTECH 1606.65
6.68
578250
26.08
-2.03
0.46
89.76
82.99
TCS 2212.80
6.19
15671500
(17.22)
6.42
1.91
95.02
94.74
TECHM 775.75
1.00
15406800
8.21
9.05
0.65
96.29
97.15
WIPRO 249.90
3.65
18211200
(29.64)
-2.08
0.72
83.12
92.60
MISCELLANIOUS
ADANIENT 1189.55 20.10
14410000 (5.98) 7.94 0.80 78.09 88.55
APOLLOHOSP 3250.95 14.82
1840000 22.54 4.85 0.37 81.69 90.47
BATAINDIA 1356.10 (5.54) 1252900 12.83 5.36 1.39 83.14 90.38
BEL 130.60 9.24
30286000 (26.75) 7.53 0.67 78.06 88.70
CONCOR 560.85 1.26
5472063 (1.07) 8.30 0.80 84.16 90.15
CUMMINSIND 861.45 2.00
1057200 (31.06) 5.17 0.46 78.52 87.59
INDIGO 1647.55 (0.86) 3679500 7.90 -6.50 0.47 74.84 89.74
OIL & GAS
BPCL 421.45 (0.28) 41000400 (10.79) 5.90 1.03 90.98 88.90
GAIL 135.30 4.84
30451200 23.66 4.84 0.69 43.25 74.43
GUJGASLTD 532.50 3.15
792500 (26.45) 7.76 2.25 82.34 #N/A
HINDPETRO 231.00 0.85
21667500 (18.56) 7.38 0.91 89.75 90.15
IGL 508.15 0.40
3958625 (23.55) 7.48 1.08 79.16 87.93
IOC
89.15
(2.78)
51857000
(17.43)
3.67
0.67
81.67
89.38
MGL 1104.25 (3.32) 1348800 32.24 7.90 1.39 90.68 93.87
ONGC 104.60 1.65
32571000 (14.89) 6.89 0.44 80.22 85.81
PETRONET 236.45 6.41
16116000 (10.50) 8.88 0.64 87.99 92.67
RELIANCE
2029.25
1.01
26814000
1.96
3.35
0.60
89.94
94.42
PHARMACEUTICAL
ALKEM 2770.05 3.98
218600 (6.90) 3.94 0.97 84.99 #N/A
APLLTD 986.90 5.81
1122550 119.70 5.77 0.72 95.78 #N/A
AUROPHARMA 972.95 15.20
9226100 8.60 7.75 0.58 93.71 94.71
BIOCON 396.25 (0.94) 17429400 37.38 7.78 0.85 84.99 92.77
CADILAHC
564.90
33.33
15562800
60.41
7.89
0.51
87.99
93.33
CIPLA 911.95 15.43
13006500 21.32 7.84 0.70 84.85 91.32
DIVISLAB 3926.75 13.23
2347000 (7.17) 5.32 0.45 87.67 93.66
DRREDDY 5128.15 16.42
3041250 (6.29) 6.62 0.56 87.01 93.56
GRANULES 332.60 8.09
5511800 5.39 4.33 0.21 86.86 #N/A
GLENMARK 569.70 27.14
7564700 38.43 7.71 0.21 85.01 90.48
LUPIN 1058.55 6.08
8459200 56.26 3.83 0.53 89.89 90.80
PEL 1696.65 (6.11) 3395150 19.82 3.31 0.93 93.02 93.23
PFIZER 5341.40 20.17
280875 432.46 8.40 0.26 94.61 #N/A
SUNPHARMA 647.75 11.65
39547200 (4.12) 6.57 0.52 93.74 96.36
TORNTPHARM 2508.10 2.05
983250 14.97 4.01 0.59 90.62 95.13
Derivatives Rollover Report
For Private Circulation Only
6
Scrip Price
Price
Change
(%) OI Futures
OI
Change
(%) COC (%) PCR-OI
Rollover
(%)
Average
Rollover
(3month)
(%)
POWER
NTPC 103.55 (0.38) 67921200 (9.14) 6.32 0.45 84.82 89.28
POWERGRID 220.80 1.15
18956000 60.26 3.85 0.38 71.00 69.19
TATAPOWER 98.30 (1.11) 119826000 (10.86) 8.68 0.82 93.18 94.85
TORNTPOWER 396.95 (3.92) 1929000 (13.34) 7.60 0.75 86.77 90.79
REAL ESTATE
DLF 250.05 (10.52) 29508600 27.16 3.92 0.98 90.59 93.44
TELECOM
BHARTIARTL 542.95 6.03
93529179 (5.38) 5.06 0.70 93.02 93.77
IDEA 8.45 (7.65) 622020000 88.54 7.76 0.58 87.05 76.37
TEXTILES
PAGEIND 30060.20 2.07
64860 22.49 7.33 1.00 89.78 94.92
SRF 6464.45 22.29
419875 38.74 4.90 0.09 85.06 92.81

Derivatives Rollover Report
For Private Circulation Only
7
Technical and Derivatives Team:
Sameet Chavan Chief Analyst - Technical & Derivatives sameet.chavan@angelbroking.com
Ruchit Jain Senior Analyst - Technical & Derivatives ruchit.jain@angelbroking.com
Rajesh Bhosale Technical Analyst rajesh.bhosle@angelbroking.com
Sneha Seth Derivatives Analyst sneha.seth@angelbroking.com
Research Team Tel: 022 - 39357600 (EXTN - 6844) Website: www.angelbroking.com
For Technical & Derivative Queries E-mail: technicalresearch-cso@angelbroking.com
DISCLAIMER
Angel Broking Limited (hereinafter referred to as “Angel”) is a registered Member of National Stock Exchange of India Limited,
Bombay Stock Exchange Limited and Metropolitan Stock Exchange Limited. It is also registered as a Depository Participant with
CDSL and Portfolio Manager and Investment Adviser with SEBI. It also has registration with AMFI as a Mutual Fund Distributor.
Angel Broking Limited is a registered entity with SEBI for Research Analyst in terms of SEBI (Research Analyst) Regulations, 2014
vide registration number INH000000164. Angel or its associates has not been debarred/ suspended by SEBI or any other regulatory
authority for accessing /dealing in securities Market. Angel or its associates/analyst has not received any compensation / managed
or co-managed public offering of securities of the company covered by Analyst during the past twelve months.
This document is solely for the personal information of the recipient, and must not be singularly used as the basis of any
investment decision. Nothing in this document should be construed as investment or financial advice. Each recipient of this
document should make such investigations as they deem necessary to arrive at an independent evaluation of an investment in the
securities of the companies referred to in this document (including the merits and risks involved), and should consult their own
advisors to determine the merits and risks of such an investment.
Reports based on technical and derivative analysis center on studying charts of a stock's price movement, outstanding positions
and trading volume, as opposed to focusing on a company's fundamentals and, as such, may not match with a report on a
company's fundamentals. Investors are advised to refer the Fundamental and Technical Research Reports available on our website
to evaluate the contrary view, if any.
The information in this document has been printed on the basis of publicly available information, internal data and other reliable
sources believed to be true, but we do not represent that it is accurate or complete and it should not be relied on as such, as this
document is for general guidance only. Angel Broking Limited or any of its affiliates/ group companies shall not be in any way
responsible for any loss or damage that may arise to any person from any inadvertent error in the information contained in this
report. Angel Broking Limited has not independently verified all the information contained within this document. Accordingly, we
cannot testify, nor make any representation or warranty, express or implied, to the accuracy, contents or data contained within this
document. While Angel Broking Limited endeavors to update on a reasonable basis the information discussed in this material,
there may be regulatory, compliance, or other reasons that prevent us from doing so.
This document is being supplied to you solely for your information, and its contents, information or data may not be reproduced,
redistributed or passed on, directly or indirectly.
Neither Angel Broking Limited, nor its directors, employees or affiliates shall be liable for any loss or damage that may arise from or
in connection with the use of this information.
